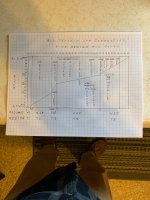
Decided I needed to create a chart to give me a perspective on where I could use some discrimination if needed. I don’t discriminate usually. I like five tones all regions but made a few changes from the stock settings. I used targets I have found at the settings you see. Yours might look different in your soil. Thanks for looking. Hope this helps, it helped me and records my settings. I started with blank charts and made charts of all the stock programs. This is the finest grid paper I could find. I think 5 squares per inch would be better but couldn’t find any.
Find's Treasure Forums
Welcome to Find's Treasure Forums, Guests!
You are viewing this forums as a guest which limits you to read only status.
Only registered members may post stories, questions, classifieds, reply to other posts, contact other members using built in messaging and use many other features found on these forums.
Why not register and join us today? It's free! (We don't share your email addresses with anyone.) We keep email addresses of our users to protect them and others from bad people posting things they shouldn't.
Click here to register!
Need Support Help?
Cannot log in?, click here to have new password emailed to you
My Manticore tone chart
- Thread starter Listener
- Start date


